NBA Back-to-Back Games Betting: Exploiting Fatigue Patterns
 Available in US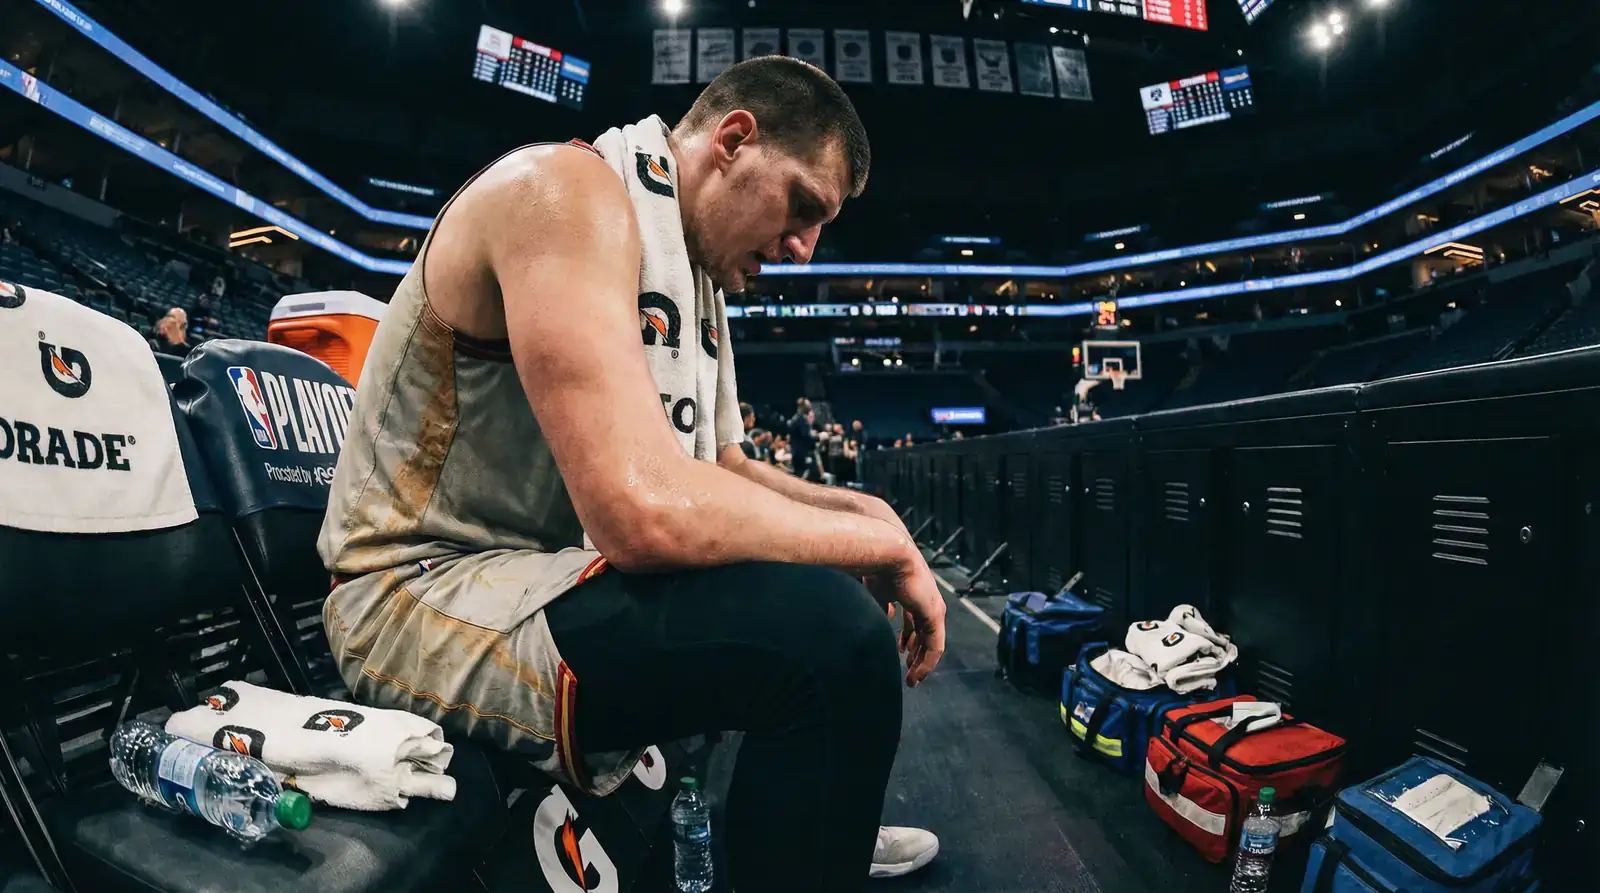
November 2021: Golden State, riding an early-season heater, hosts Memphis on the second night of a back-to-back. The Warriors had demolished Sacramento the previous evening, Curry dropping 46 points in a dominant performance. The market made Golden State -7.5 at home. Memphis won outright by 11.
Back-to-back situations create the most predictable fatigue patterns in NBA betting. Every team faces approximately 15 of these scheduling disadvantages per season – 15 opportunities where physiology works against them regardless of talent or motivation. The question isn’t whether fatigue matters; it’s whether the betting market adequately accounts for its impact.
After tracking back-to-back results for seven consecutive seasons, I’ve developed strong opinions about when these situations present genuine betting value and when the market has already priced in the disadvantage.
The Fatigue Factor: Measuring Real Impact
The numbers are stark. Research into NBA scheduling patterns shows fatigue creates measurable performance degradation of 1-3 points depending on specific circumstances. That’s not speculation – it’s documented across thousands of games with controls for opponent quality, home court, and other variables.
The NBA’s 82-game schedule compresses into roughly 170 days, creating inevitable back-to-back situations. When a team plays Sunday night, travels, and tips off Monday evening, players face reduced sleep, disrupted recovery protocols, abbreviated shootaround time, and accumulated physical stress. Elite athletes are still human bodies subject to biological limits.
What I track specifically: points scored per 100 possessions drops measurably on back-to-back second nights. Defensive rating suffers even more – tired legs mean slower rotations, missed closeouts, and conceded offensive rebounds. The net effect typically ranges from 2-4 points of expected margin swing, with the upper end reserved for particularly demanding circumstances.
Interestingly, the first quarter often masks fatigue effects. Adrenaline and game-time preparation can override tiredness early. It’s the second half – particularly the fourth quarter – where back-to-back fatigue manifests most dramatically. Teams on schedule disadvantages lose close games at elevated rates, suggesting their ability to execute in crunch time degrades more than overall statistics capture.
One nuance: not all back-to-backs are equal. A home-home back-to-back where the team sleeps in their own bed creates less fatigue than a road-road situation requiring overnight travel. The market generally adjusts for this, but not always proportionally to the actual impact.
Rest Advantage Scenarios
The inverse of back-to-back fatigue is rest advantage – and it’s equally exploitable. A team coming off three or four days rest facing a back-to-back opponent creates maximum rest differential. These spots historically produce some of my most reliable edges.
Consider the typical scenario: Team A hasn’t played since Thursday. It’s now Sunday. They’ve had full practices, video sessions, and recovery time. Team B played Saturday night in another city and flew in overnight. The physiological mismatch is substantial, yet bookmakers sometimes set lines that don’t fully capture the disparity.
My database shows rest advantages compound in specific situations. When the rested team is also the home team, the combined edge often exceeds what either factor would suggest independently. When the rested team has a particular matchup advantage they’ve had time to gameplan for, the edge grows further.
The regular season presents roughly 200 games where rest differential exceeds two days. Not all are bettable – sometimes the fatigued team is simply more talented – but filtering for competitive matchups with significant rest disparity produces a solid foundation for investigation.
One caution: the market has become increasingly sophisticated about rest situations. Sharp bettors and analytical models now incorporate rest data systematically, meaning obvious rest advantages are often baked into opening lines. The value lies in identifying when the adjustment is insufficient rather than when it’s absent entirely.
Travel Plus Fatigue: Compound Effects
The most exploitable back-to-back situations involve travel complications. A team playing in Miami on Saturday night, then hosting in Minnesota on Sunday evening, faces not just fatigue but time zone disruption, climate adjustment, and minimal recovery opportunity. These compound scenarios exceed the standard fatigue adjustment.
I categorise back-to-backs into tiers based on travel demands. Tier 1: same-city or minimal travel (under 300 miles). Tier 2: moderate travel with no time zone change. Tier 3: significant travel crossing time zones. Tier 4: extreme travel combining distance, time zones, and climate shifts. Each tier carries different expected performance degradation.
Eastern Conference teams travelling west face particular challenges. Playing a game that tips off at 10:30 PM body time, then flying east for a game the following evening, creates circadian disruption that sports science research has documented extensively. Western teams travelling east encounter similar issues in reverse, though the adjustment pattern differs slightly.
Altitude considerations multiply travel effects. A team playing in Denver on Saturday, then travelling to sea level for Sunday, faces both elevation adjustment and standard back-to-back fatigue. The body doesn’t recalibrate instantly – oxygen processing, hydration balance, and sleep quality all suffer during the transition period.
I maintain a scheduling spreadsheet that flags compound situations automatically. When multiple fatigue factors align – travel plus altitude plus time zone plus high-intensity previous game – the expected impact often exceeds what the betting market assigns.
Using Back-to-Back Data Effectively
Knowing fatigue exists isn’t enough – the profitable approach requires systematic integration with other analysis. A fatigued team might still cover if they’re significantly more talented than their opponent. The edge lies in identifying where fatigue tips competitive matchups.
My process: identify all back-to-back second games for the week, note rest situations for opponents, calculate the “natural” spread based on team quality and home court, then adjust for fatigue factors. If my adjusted line differs significantly from the market, I investigate further. If the discrepancy persists after considering injuries, recent form, and motivational factors, I have a potential bet.
What doesn’t work: blindly fading every team on a back-to-back. The market knows about scheduling; it adjusts lines accordingly. The average back-to-back team probably gives up 1.5-2 points of line value already built in. You need to find spots where the actual impact exceeds the built-in adjustment.
Load management complicates analysis. Elite players increasingly sit out back-to-back second games, particularly early in the season or when minor injuries linger. A line set assuming LeBron plays becomes mispriced if he rests. Monitoring injury reports right up to tip-off is essential for back-to-back situations – late scratches create sudden value opportunities.
For deeper exploration of situational analysis including back-to-back performance tracking, the ATS trends analysis provides comprehensive frameworks for identifying when schedule-based factors create genuine betting edges.
How much do back-to-back games affect NBA performance?
Research shows back-to-back situations create performance degradation of 1-3 points depending on travel demands, rest differential with opponents, and specific circumstances. The impact manifests most dramatically in fourth quarters when fatigue peaks.
Should I always fade teams on back-to-backs?
No – the market generally adjusts lines for scheduling disadvantages. Blindly fading back-to-back teams won’t produce consistent profits. The value lies in identifying when actual fatigue impact exceeds the market’s built-in adjustment, particularly in compound situations involving travel complications.
How many back-to-backs are in an NBA season?
Each NBA team faces approximately 15 back-to-back situations during the 82-game regular season. The league has reduced these from historical levels but cannot eliminate them entirely given the compressed schedule spanning roughly 170 days.
Prepared by the nba Betting Chart editorial staff.