NBA Three-Pointer Props: Betting on Long-Range Shooting Performance
 Available in US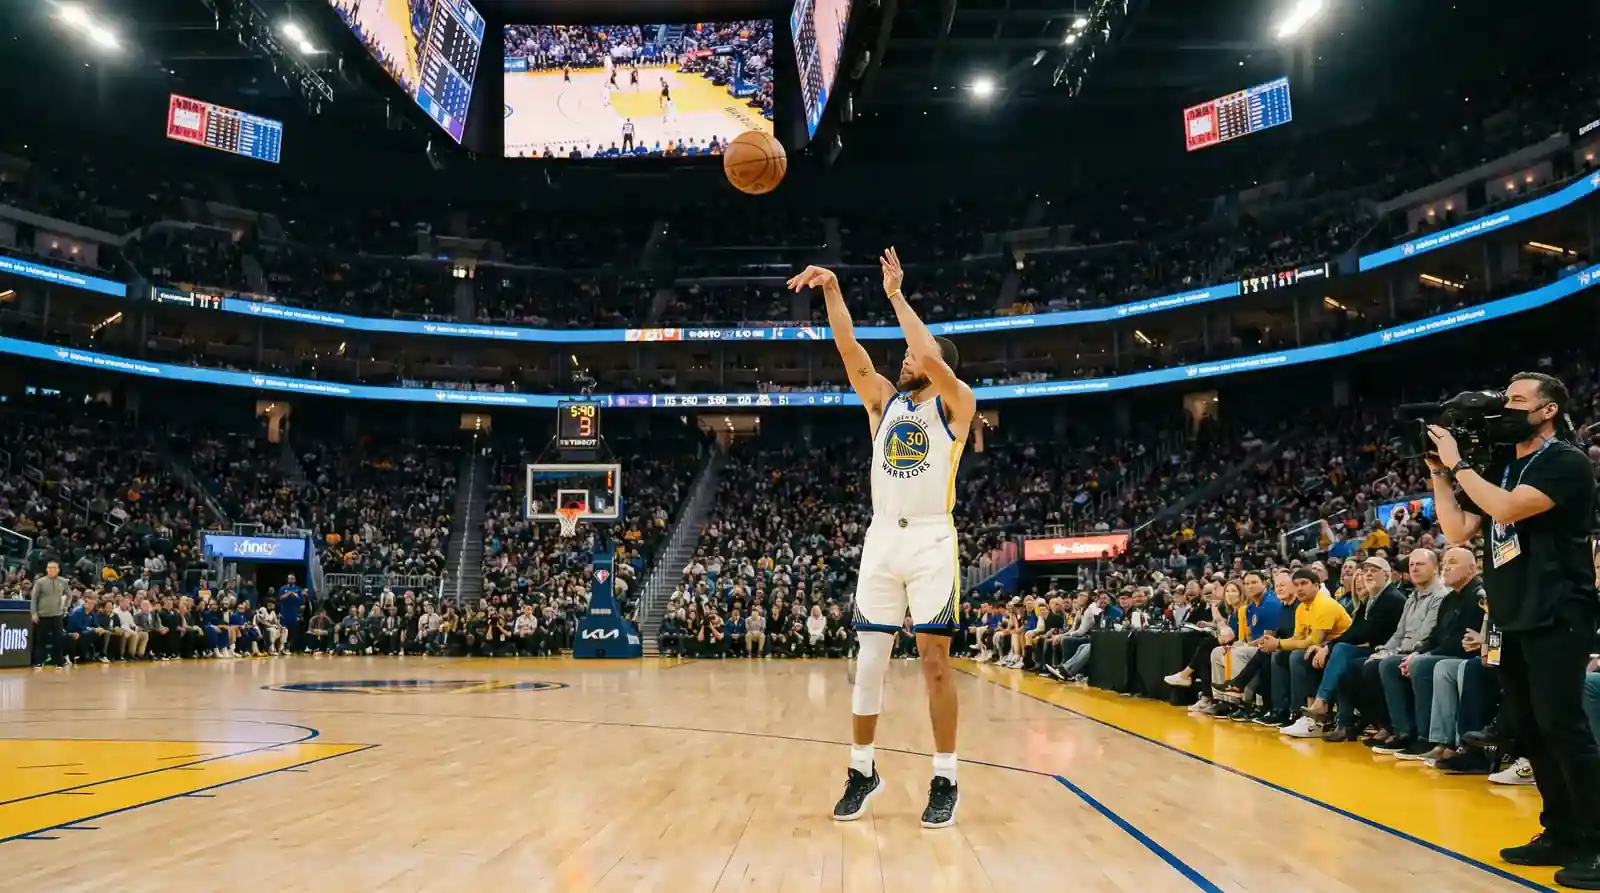
Three-pointer props taught me humility. A 40% three-point shooter seems reliable until you realize that means he misses 60% of his attempts. On any given night, that 40% could manifest as 2-for-10 or 6-for-10 with roughly equal probability. The variance in three-point shooting makes these props simultaneously attractive and treacherous.
The modern NBA revolves around the three-point shot. Teams launch 35+ threes per game, individual players regularly attempt 8-10 per night, and bookmakers offer robust markets on made threes and attempt totals. The action flows because everyone has opinions about shooting – but few understand the statistical realities that make three-point props uniquely volatile.
My approach to three-pointer props has evolved toward extreme selectivity. I bet them rarely, in specific situations where factors align beyond simple averages. This guide explains what those situations look like.
Attempts vs Made: Different Markets, Different Variance
Three-point attempts and made threes are fundamentally different markets with different risk profiles. Attempts depend on opportunity and role; makes depend on attempts plus the highly variable factor of shot-making. Understanding this distinction shapes how I approach each market.
Attempt props carry lower variance because they’re more controllable. A player’s three-point attempts correlate with game plan, matchup, and role – factors that produce relatively consistent outcomes. If a shooter averages 7.5 attempts per game, his nightly range might be 5-10 rather than the 0-12 range his makes could show.
Made three props introduce shooting variance on top of attempt variance. A player needs both the attempts and the makes to hit his number. Going 2-for-8 from three produces the same “made” outcome as going 2-for-3 despite vastly different shooting performances. The additional randomness makes made three props harder to project accurately.
I prefer attempt props when I have conviction about opportunity – a scheme that generates open threes for a specific shooter, or a matchup that invites long-range attacks. I approach made props more cautiously, requiring larger perceived edges to overcome the inherent variance.
The juice on three-pointer props typically runs standard -110 on both sides, same as other markets. But that standard juice obscures the reality that made three props are harder to handicap than rebounds or assists props of equivalent juice. The pricing doesn’t reflect the additional variance.
Understanding Three-Point Variance
Three-point shooting variance is not a bug to overcome – it’s a fundamental feature to respect. A 38% three-point shooter over a season sample will have individual games at 20% and games at 60%. Neither represents his “true” ability; both are normal statistical fluctuations around a stable baseline.
Small sample sizes amplify variance dramatically. On 8 three-point attempts, the difference between 2 makes and 4 makes is just two shots – a razor-thin margin that determines prop outcomes. This isn’t like rebounding where effort and positioning create more predictable results. It’s pure shot-making variance on top of opportunity factors.
Hot and cold streaks exist but are notoriously difficult to predict. A shooter who’s gone 2-for-20 from three over three games might be “due” for regression – or might be genuinely slumping for mechanical reasons. Similarly, a shooter on fire might continue or might crash back to earth. Chasing streaks in three-point props is a losing strategy in my experience.
What I do trust: volume tendencies. A player who attempts 9 threes per game will keep attempting them regardless of recent results. Shot selection habits are stickier than shooting percentages. This is why attempt props often provide more stable betting surfaces than made props.
The psychological temptation is to bet unders after a player has a hot shooting night (“he can’t sustain that”) or overs after cold nights (“he’s due”). Both instincts misunderstand how variance works. Tonight’s outcome is largely independent of last night’s. Regression exists over samples, not game-to-game predictions.
Opponent Three-Point Defence
Opponent three-point defence is often cited but rarely as predictive as people assume. Teams vary in three-point percentage allowed, but the variance in these numbers contains substantial noise. A team “allowing” 38% from three might simply have faced hot-shooting opponents rather than playing poor perimeter defence.
What matters more than opponent three-point percentage allowed is how the defence generates or surrenders three-point attempts. Some schemes concede open corner threes by design while protecting the rim. Others pressure the perimeter but allow drives. The type of threes allowed – contested versus open, corner versus above-the-break – affects outcomes more than raw percentages.
I evaluate defensive scheme rather than results. Does this defence switch everything, creating mismatches that lead to open threes? Do they go under screens, daring shooters to fire? Do they aggressively close out, making contested threes the primary option? These scheme questions predict individual shooter outcomes better than league-wide defensive rankings.
Individual defender assignments matter for star shooters who attract specific attention. When an elite perimeter defender shadows a shooter all night, attempt volume often drops as the shooter sees fewer clean looks. The attempts that do come are more contested, affecting both volume and efficiency.
Recent defensive form provides better signal than season-long averages. A defence that’s surrendered heavy three-point makes over its last five games might be exhibiting exploitable patterns – or might be due for regression toward its season baseline. Context determines which interpretation applies.
Home and Away Shooting Splits
Home court advantage manifests partly through shooting. Players generally shoot better at home – familiar rims, comfortable sight lines, supportive crowds all contribute. The league-average home court advantage of approximately 3 points includes offensive efficiency gains that translate to three-point shooting.
Individual players show varying home-road shooting splits. Some shooters are remarkably consistent regardless of venue. Others show pronounced home advantages, possibly from arena-specific factors or psychological comfort. I track these splits for players I frequently bet, looking for those whose home-road differential creates prop opportunities.
Road trips through difficult environments affect shooting. Altitude in Denver genuinely impacts visiting players – the thinner air affects shot trajectory and the cardiovascular demands of defence leave less energy for offensive precision. The Nuggets’ home court advantage of +4.6 points, best in the league, includes shooting-related components.
Back-to-back situations on the road compound shooting challenges. Tired legs affect shooting mechanics and concentration. Shooters on schedule disadvantages show slightly reduced three-point efficiency in my tracking, though the effect isn’t dramatic enough to bet blindly.
For broader context on how home court and situational factors affect NBA betting across all markets, the comprehensive betting chart guide covers these dynamics systematically.
Are three-pointer props high variance in NBA?
Yes, three-pointer props carry higher variance than most other prop markets. A 38% shooter can legitimately go 2-for-10 or 6-for-10 on any given night. This variance makes three-point props harder to project accurately despite appearing straightforward.
How does home court affect shooting percentages?
Players generally shoot better at home due to familiar rims, comfortable sight lines, and crowd support. The league-average home court advantage of roughly 3 points includes shooting efficiency gains. Individual players show varying home-road splits worth tracking.
What stats predict three-pointers made?
Three-point attempt volume is more predictable than makes. Shooting percentage provides baseline expectations, but nightly outcomes vary substantially. Defensive scheme against shooters, individual defender matchups, and home-road context all influence outcomes beyond raw averages.
Written by the editors at nba Betting Chart.