NBA Over/Under Betting Guide: Totals Strategy for UK Bettors
 Available in US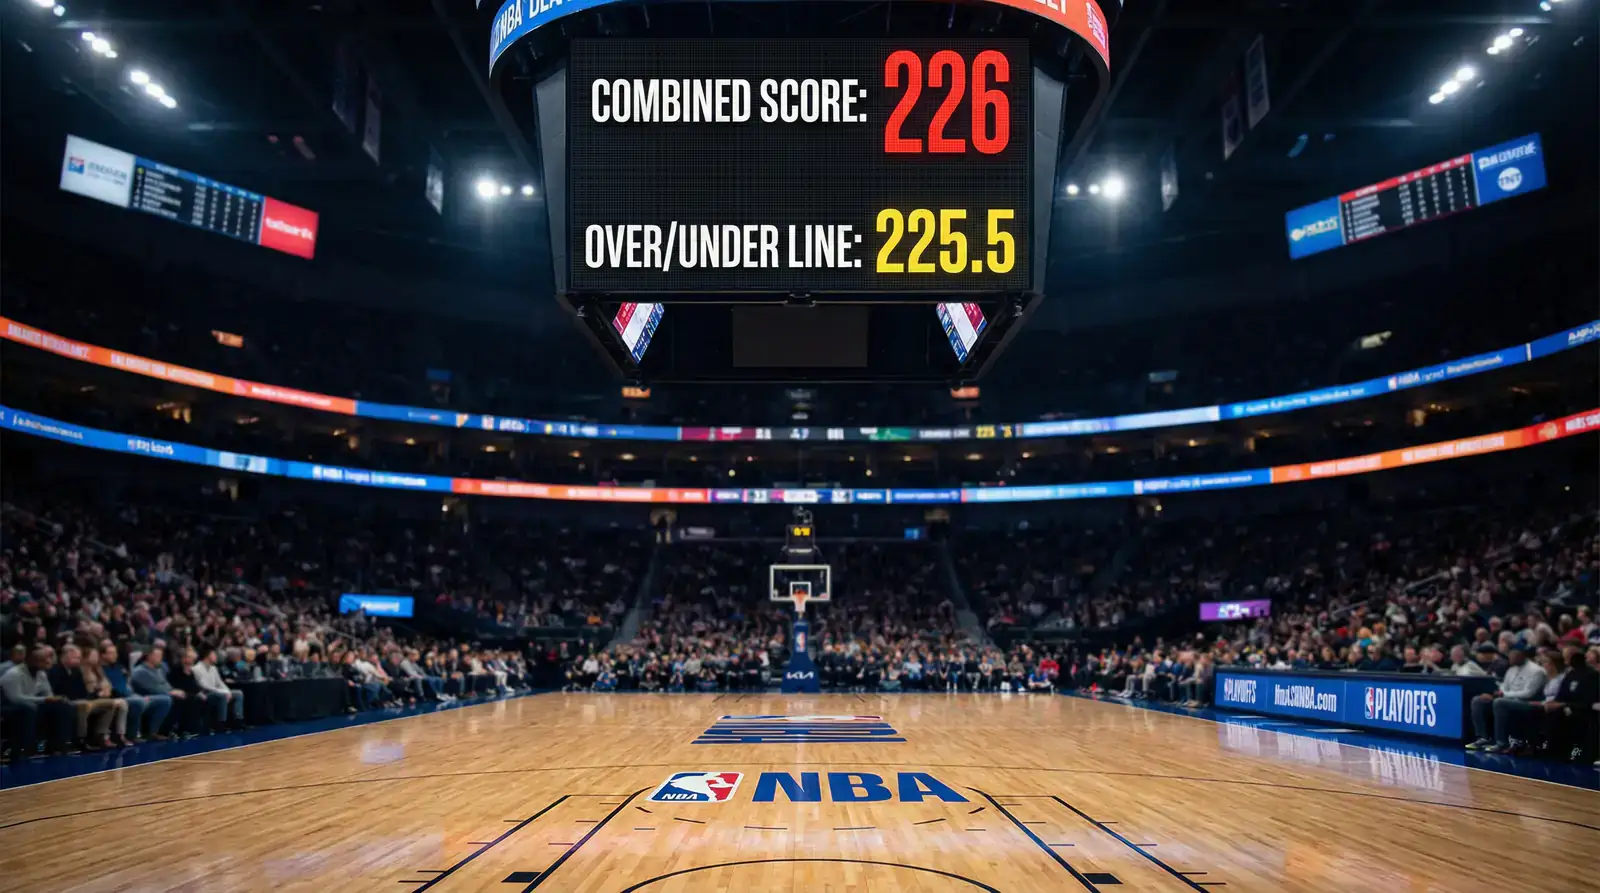
The highest-scoring NBA game I ever bet on finished 168-161 in double overtime. The total was set at 228. I had the over. By halftime, with the score sitting at 78-72, I was already counting my winnings. Then both teams decided defence existed, the second half produced 89 combined points, and I spent the fourth quarter doing frantic mental arithmetic while watching what felt like a completely different sport.
Totals betting – picking whether the combined score goes over or under the bookmaker’s line – offers something spreads and moneylines cannot: complete neutrality about who wins. You’re betting on how the game unfolds, not which team performs better. For UK bettors familiar with football’s under 2.5 goals market, the concept translates directly, though NBA totals operate in a wildly different scoring environment.
After nine years of analysing these markets, I’ve learned that totals betting rewards research more than any other market type. The factors that influence scoring are measurable, trackable, and surprisingly predictable – once you know where to look.
How NBA Game Totals Work
When I first started betting NBA totals, I made the rookie mistake of thinking 220 points meant roughly 110-110. The reality is far more nuanced. Bookmakers set totals based on projected final scores that rarely split evenly – a 225.5 total might anticipate something like 118-107.
The half-point matters enormously. That “.5” eliminates push scenarios where both sides get refunded. NBA totals typically range from around 208 to 245 depending on the teams involved, with the league average hovering somewhere in the mid-220s during recent seasons. A total of 228.5 means you’re betting on whether teams combine for 229 or more (over) versus 228 or fewer (under).
Standard juice on totals runs -110 on both sides, identical to spread betting. This means you need to hit roughly 52.4% of your bets to break even after the bookmaker takes their cut. Some books shade totals slightly toward the over or under based on public betting patterns – recreational bettors famously prefer overs because they’re more exciting to watch.
What trips up many bettors is overtime. Any overtime points count toward the total. That 228.5 under bet that looked locked at 108-106 with 30 seconds remaining? It can absolutely lose if the game goes to overtime. I’ve had this happen more times than I care to remember, and it never gets less painful.
One mechanical aspect worth noting: totals can move several points from opening to tip-off based on injury news, weather (for games in arenas with roof complications), and sharp betting action. Tracking these movements often reveals where professional money sits.
Pace and Scoring: The Primary Driver
December 2023: I’m staring at a Pacers-Hawks total of 241.5, thinking it looks astronomical. Both teams played at breakneck pace that season, running and gunning at every opportunity. The game finished 152-147. The under never had a chance.
Pace – measured as possessions per 48 minutes – is the single most important factor in totals betting. More possessions mean more scoring opportunities for both teams. Two fast-paced teams facing each other can easily produce totals 20 points higher than two defensive-minded, slow-tempo squads. The research backs this up: about 19% of NBA games are decided in the fourth quarter alone, which tells you how much variance exists in how games flow.
When I analyse a total, I start with pace matchup data. The league’s fastest teams average around 102-104 possessions per game; the slowest grind out 96-98. That 6-8 possession differential translates to roughly 12-16 points of expected scoring difference. Bookmakers factor this in, but they’re working with season averages that don’t always reflect recent form.
Here’s where opportunity lives: teams don’t maintain consistent pace throughout a season. Injuries to key ball handlers slow tempo. Coaching adjustments mid-season alter offensive philosophy. A team playing the second night of a back-to-back naturally plays fewer possessions due to fatigue – the league’s 82-game schedule creates measurable fatigue patterns that affect totals by 1-3 points depending on circumstances.
I maintain a spreadsheet tracking each team’s pace over their last five games against their season average. When that number diverges significantly, the market often hasn’t caught up.
Defensive Ratings and Their Impact
Pace tells you how many possessions will occur. Defensive rating tells you how efficiently those possessions convert to points. I learned this distinction the hard way after several losing months where I focused exclusively on offensive firepower.
Defensive rating measures points allowed per 100 possessions, adjusting for pace differences. A team allowing 105 points per 100 possessions plays fundamentally different defence than one surrendering 115. When two poor defensive teams meet, totals tend to sail over. When elite defences clash, unders become far more viable.
The nuance I’ve developed over years of tracking: individual defensive matchups matter as much as team ratings. If a team’s best perimeter defender is injured, opposing guards score more efficiently. If a rim protector sits out, drives to the basket convert at higher rates. These adjustments often happen too late for bookmakers to fully incorporate.
What I watch specifically: defensive rating splits between home and away. Some teams defend significantly better in their own arena – crowd energy, familiar sight lines, comfort with defensive schemes all contribute. A team with a 108 road defensive rating but 103 at home presents different totals implications depending on venue.
The most profitable angle I’ve found involves teams switching defensive schemes mid-season. A coach decides to prioritise defence after a losing streak, implements new coverages, and suddenly a previously high-scoring team grinds out low totals for several weeks. The market takes time to adjust, and that lag creates value.
Situational Factors That Move Totals
A few seasons back, I noticed something peculiar: totals in games between divisional rivals consistently went under at a higher rate than the market implied. The theory? Familiarity breeds defensive preparation. Teams that play each other four times per season know offensive tendencies intimately.
Back-to-back situations affect totals dramatically, particularly when one team is rested and the other played the previous night. The fatigued team typically scores fewer points and allows more defensively – but the net effect on totals varies. When both teams are on back-to-backs, offensive efficiency drops significantly while defensive intensity wanes, creating unpredictable outcomes.
Altitude deserves mention specifically. Denver’s home arena sits at 5,280 feet, and visiting teams genuinely struggle with the thinner air. This isn’t myth – the Nuggets consistently outperform at home, carrying a home court true performance rating of +4.6 points, the best in the league. For totals, this typically means Denver games at home trend slightly higher than road games due to the cardiovascular advantage.
Late-season tanking creates peculiar totals situations. Teams out of playoff contention often rest veterans, play developmental lineups, and focus on individual player growth rather than winning. These games become unpredictable from a totals perspective – sometimes they’re blowouts that go under as losing teams stop competing in fourth quarters, other times they’re chaotic high-scoring affairs between reserve players trying to earn roster spots.
My checklist before betting any total: pace matchup, recent defensive form, injury report (particularly perimeter players and rim protectors), back-to-back status, altitude if Denver is involved, and season context. If I can’t form a confident view on all six factors, I pass on the bet. For comprehensive strategies on finding value in these situations, the complete NBA betting chart guide covers additional analytical frameworks.
What affects NBA game totals the most?
Pace – the number of possessions per game – is the primary driver. Fast-paced teams create more scoring opportunities. Defensive efficiency, injuries to key players, and back-to-back fatigue also significantly impact totals.
How do back-to-backs impact NBA over/under bets?
Teams on back-to-backs typically show reduced offensive efficiency and defensive intensity due to fatigue. The 82-game NBA schedule creates measurable fatigue patterns that can affect totals by 1-3 points. Check both teams’ rest status before betting totals.
What is a push in NBA totals betting?
A push occurs when the combined score lands exactly on the total – for example, 226 points with a line of 226. Most books use half-points like 226.5 to eliminate pushes. When pushes occur, stakes are refunded to bettors.
Prepared by the nba Betting Chart editorial staff.