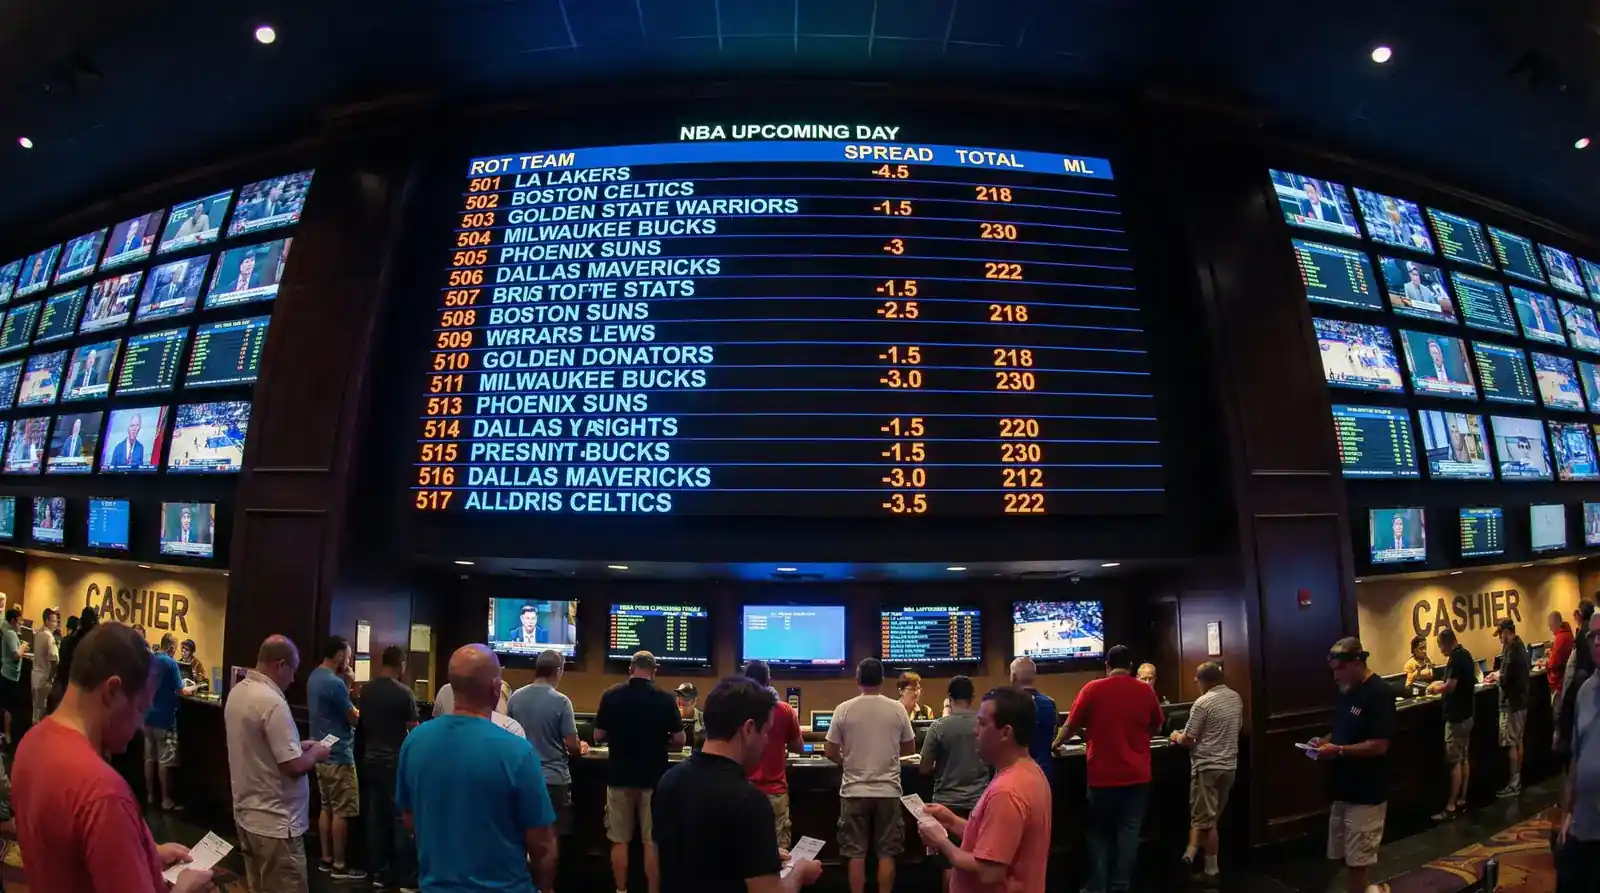
NBA Public Betting Percentages: Reading Recreational Bettor Patterns
 Available in US
My contrarian phase nearly bankrupted me. After reading that fading the public was profitable, I spent an entire season betting against whatever side attracted majority action. The Lakers drawing 75% of bets? I backed their opponent. Warriors with 80% public support? Give me the underdog. The results were disastrous – a 38% win rate and months of recovery.
Public betting percentages show where recreational money lands. These numbers, published by various tracking services, reveal how bets distribute across markets. The common wisdom suggests that since the public loses long-term, betting against them should be profitable. Like most oversimplified betting wisdom, this contains a kernel of truth buried under dangerous assumptions.
The UK betting market processes approximately 290 million online sports bets monthly. Understanding how these masses behave – and crucially, when their behaviour creates opportunity versus noise – is essential for any serious NBA bettor.
Tickets vs Money: The Critical Distinction
Not all bets are equal. A £10 recreational wager and a £10,000 sharp bet count the same in ticket percentages but carry vastly different market significance. This is why sophisticated analysis distinguishes between ticket percentage (number of bets) and money percentage (total dollars wagered).
Ticket percentage reflects the crowd – where casual bettors place their entertainment money. Money percentage reveals where serious capital sits. When these numbers diverge significantly, interesting situations emerge. A game showing 70% of tickets on Team A but only 45% of money suggests sharp bettors are loading up on Team B in larger sizes.
The mechanism matters because bookmakers respond to liability, not vote counts. Ten thousand £10 bets create £100,000 exposure. One hundred £5,000 bets create £500,000 exposure. Bookmakers adjust lines based on where their actual risk sits, which is why money percentage moves markets more than ticket counts.
I weight money percentage far more heavily than ticket percentage in my analysis. Knowing that 65% of bettors took the favourite tells me something about public sentiment. Knowing that only 40% of money sits on that favourite tells me something about where informed capital disagrees with the crowd.
Data availability varies. American tracking services provide the most detailed breakdowns, but UK bettors can access much of this information through various online resources. The key is finding consistent data sources and tracking discrepancies over time rather than reacting to single-game readings.
Fading the Public: Does It Work?
The “fade the public” strategy sounds compelling: the public loses, therefore bet against them. If only betting were that simple. My painful season-long experiment revealed the strategy’s fundamental flaw – the bookmakers already account for public tendencies in their lines.
When bookmakers know 70% of bets will land on a popular favourite, they shade the line accordingly. The favourite might “deserve” to be -5 based on pure talent assessment, but they open at -6.5 knowing public money will pour in regardless. By the time you fade the public, you’re not exploiting crowd behaviour – you’re taking the number bookmakers want you to take.
Academic research supports this dynamic. Studies consistently show that Vegas oddsmakers are remarkably accurate in their lines. The public bias toward favourites, overs, and popular teams is well-documented, which means it’s well-anticipated. Blindly fading creates no edge when the line already incorporates expected public behaviour.
Where fading can work: extreme public percentages on games where the line hasn’t moved to reflect that action. If 80% of tickets land on a favourite and the line stays static or moves toward the underdog, something unusual is happening. That’s potentially exploitable. If the line moved toward the favourite as expected, the “fade” was already priced out.
My current approach: I note public percentages but never bet solely based on them. They’re context, not catalyst. When my independent analysis aligns with a contrarian position and extreme public percentages exist on the other side, I have additional confidence. Fading the public without supporting analysis is just gambling with extra steps.
When the Public Gets It Right
Here’s a truth contrarian bettors hate to acknowledge: the public isn’t always wrong. Sometimes 75% of bettors backing a favourite reflects genuine superiority that translates to covering spreads. Betting against obvious quality to feel clever is its own form of bias.
Public consensus tends to be most reliable in straightforward situations. Elite teams at home against clearly inferior opponents, revenge games with obvious motivational factors, nationally televised matchups where public attention correlates with genuine insight – these situations often see public money landing on the correct side.
Research on fan engagement patterns shows interesting dynamics: 30% of millennials and 24% of Gen Z bettors became fans of new teams through gambling engagement. This suggests an increasingly sophisticated betting public that watches more games, consumes more analysis, and develops genuine basketball knowledge. The “dumb public money” characterisation grows less accurate each season.
I’ve learned to distinguish between “public money” and “public wisdom.” Casual bettors backing LeBron because he’s famous is public money. A genuine consensus forming around a team’s superior recent form, matchup advantages, and injury situations is closer to public wisdom – and often correct.
The filter I apply: why does the public favour this side? If the answer reduces to team popularity, star power, or recent hype, contrarian instincts might apply. If the answer involves substantive factors I can verify independently, the public might simply be right.
Building a Contrarian Strategy
A sustainable contrarian approach requires nuance beyond simple opposition. The goal isn’t to bet against the public reflexively – it’s to identify situations where public bias creates mispriced lines that your analysis can exploit.
My contrarian checklist includes four requirements before considering a fade. First, public percentage exceeds 65% on one side. Below that threshold, the imbalance is too mild to matter. Second, line movement contradicts public direction or stays suspiciously static. If the line moved with public money, the fade is already priced away. Third, my independent analysis supports the contrarian side on merit. I need reasons beyond “the public disagrees.” Fourth, the game involves factors the public typically misjudges – rest situations, travel complications, or matchup specifics that casual observers overlook.
When all four conditions align, I have a contrarian bet worth considering. When only two or three align, I pass. This filter reduced my contrarian betting volume by roughly 70% but dramatically improved results on the bets I actually placed.
Situational contrarianism works better than blanket opposition. The public overvalues certain things consistently: recent results, star player presence, home court for popular teams, and overs during fast-paced matchups. Building contrarian positions around these specific tendencies produces better outcomes than general fade strategies.
For comprehensive frameworks on integrating public betting data with other analytical factors, the ATS trends analysis shows how to weigh multiple inputs systematically rather than relying on any single indicator.
What do NBA public betting percentages show?
Public betting percentages reveal how bets distribute across NBA markets – what percentage of tickets and money land on each side. These numbers help identify where recreational bettors favour certain outcomes, creating potential contrarian opportunities when combined with other analysis.
Is fading the public profitable in NBA betting?
Blindly fading the public is not consistently profitable because bookmakers already adjust lines to account for expected public behaviour. However, combining extreme public percentages with independent analysis and line movement confirmation can identify genuinely mispriced situations.
Where can I find NBA betting percentages?
Various sports betting analytics services publish public betting percentages. American-focused sites provide the most comprehensive data. Look for sources that distinguish between ticket percentage and money percentage – the divergence between these metrics often reveals more than either number alone.
Written by the editors at nba Betting Chart.