NBA Player Props Guide: Stats-Based Approach to Performance Betting
Three seasons ago, I shifted a significant portion of my NBA betting activity away from game outcomes and toward individual player performance. The reason was simple: I kept finding myself more confident about whether a specific player would exceed 25 points than whether his team would cover a 6-point spread. NBA player props allowed me to bet on what I actually knew rather than what I could only guess at.
The proposition betting market has exploded in recent years, transforming from a niche offering into one of the fastest-growing segments of basketball wagering. Where bookmakers once listed a handful of points props for star players, they now offer dozens of markets per game covering everything from rebounds to three-pointers made to highly specific combo stats. For UK bettors approaching NBA betting with analytical backgrounds from football or other sports, props offer a path into basketball that rewards research over gut instinct.
This guide breaks down the statistical approach to player props – which numbers actually predict performance, how to research matchups efficiently, and where the market tends to misprice opportunities. If you want the broader context of how props fit into the complete NBA betting landscape, the comprehensive betting chart guide covers all market types. Here, we focus exclusively on turning player statistics into actionable wagers.
Table of Contents
Types of NBA Player Props Available
Walking into prop betting without understanding the menu is like entering a restaurant that only lists dishes in code. The terminology looks familiar – points, assists, rebounds – but the specific constructions take time to learn. Let me walk you through what you will actually encounter when browsing NBA props at UK bookmakers.
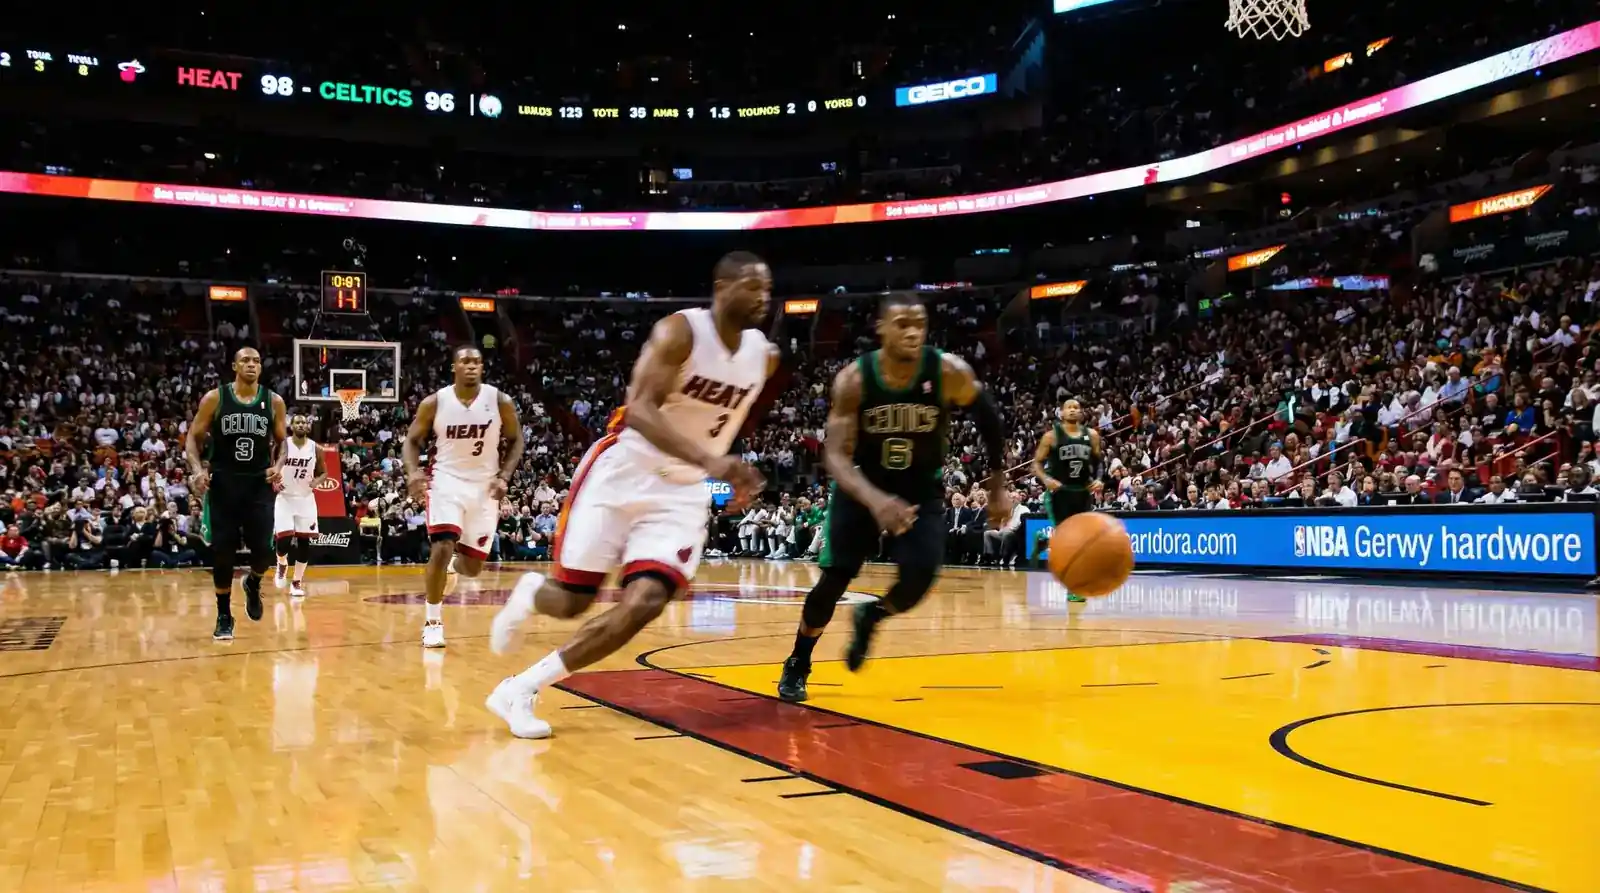
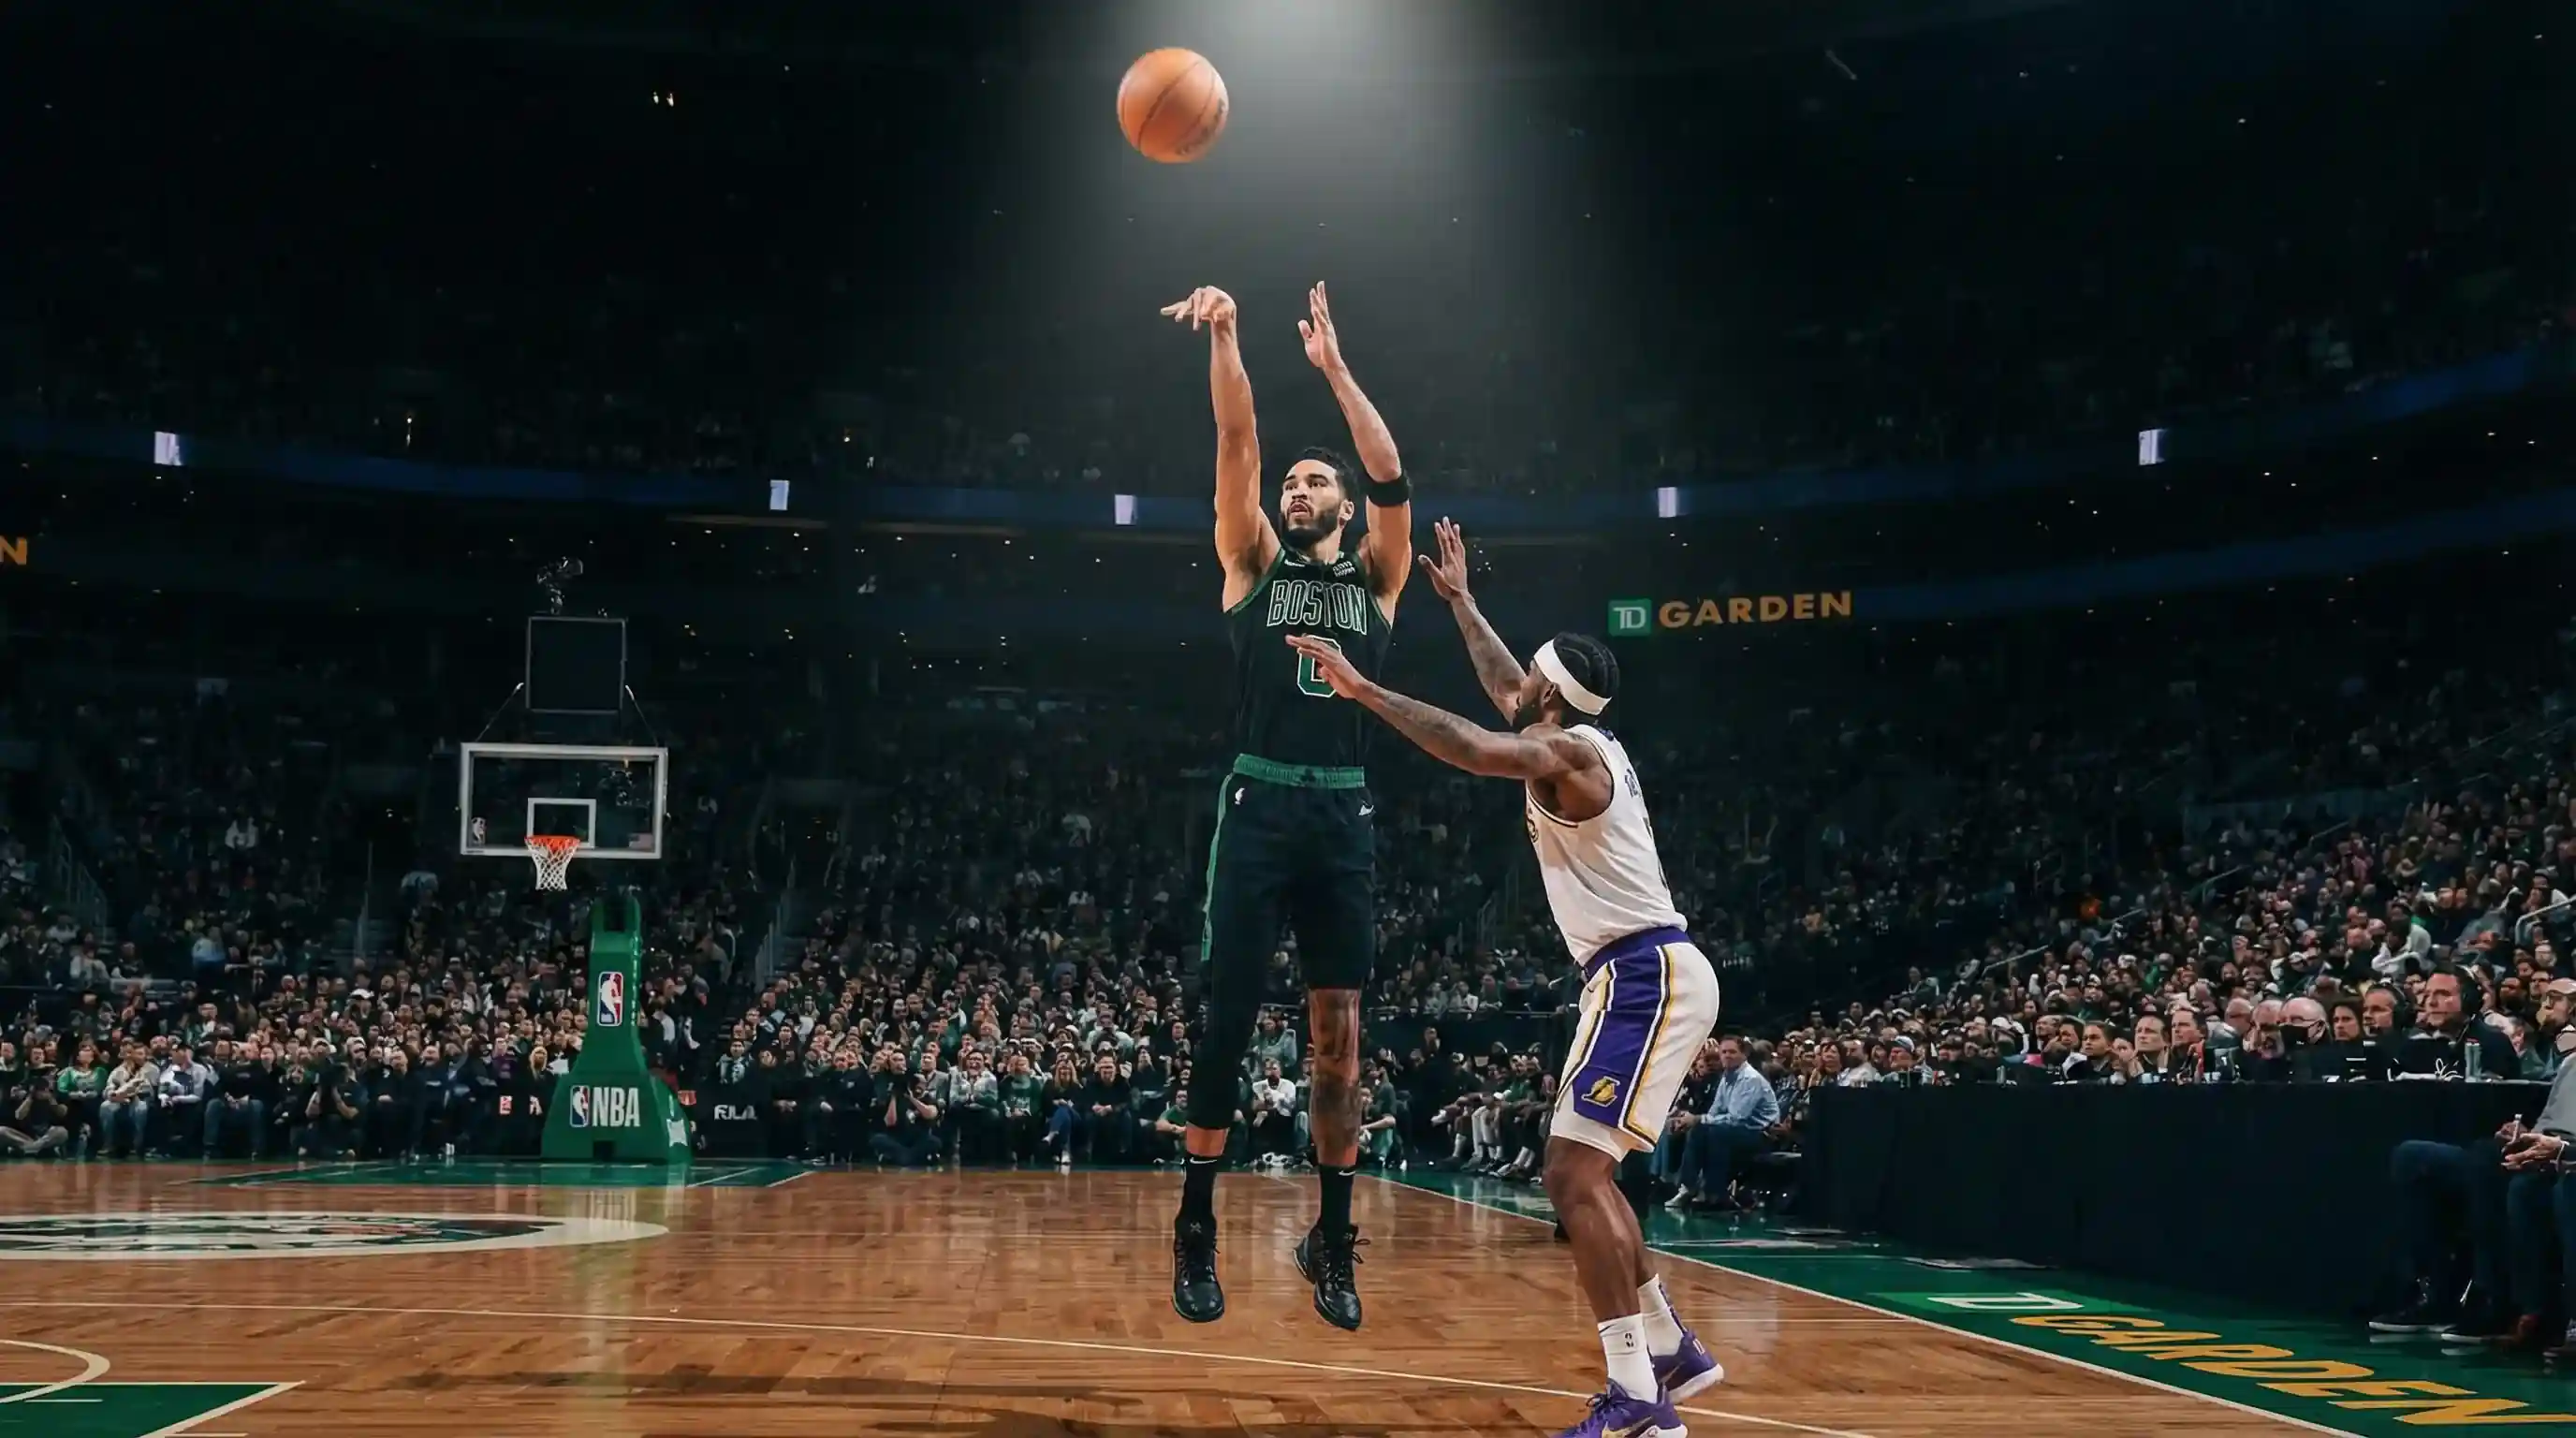
Points props dominate the market. These ask whether a player will score over or under a specified total. You might see “Jayson Tatum Over 27.5 Points at 1.87” – meaning if Tatum scores 28 or more, you win. Score 27 or fewer, you lose. The half-point eliminates pushes just as it does with game spreads. Points props exist for virtually every player expected to see significant minutes, though lines for bench players carry more variance and wider margins.
Rebounds props follow the same structure but measure a different skill set entirely. A centre might have a line of 11.5 rebounds while a point guard sits at 4.5. The positional variation is enormous, and so is the contextual dependency. Rebounds correlate heavily with playing time, pace, and opponent rebounding tendencies in ways that points do not always mirror.
Assists props capture playmaking output. Point guards typically see the highest lines – elite distributors might have props around 9.5 or 10.5 assists – but wing players and even some centres have assist markets when their roles involve creation. Assists depend on teammates converting shots, adding a layer of dependency that pure scoring props lack.
Combo props merge multiple statistics into a single market. The most common is PRA – points plus rebounds plus assists combined. A star player might have a PRA line of 42.5, requiring him to accumulate those counting stats across all three categories. Combo props reduce variance compared to single-stat props because a poor shooting night can be offset by extra rebounds or assists. They also create opportunities when you believe a player will produce volume without certainty about which statistics will carry the load.
Specialty props cover specific actions. Three-pointers made is popular for shooters – “Stephen Curry Over 4.5 Threes Made” bets on his long-range production specifically. Steals, blocks, and turnovers props exist but carry high variance due to their lower base rates. Double-double props ask whether a player will reach 10 or more in two statistical categories. These yes/no markets price differently than over/under structures, with the “yes” side often carrying longer odds.
First basket and first team basket props bet on who scores the opening points. These carry significant luck elements but some bettors find edges based on tip-off tendencies and set plays teams run to start games. I consider them closer to entertainment bets than analytical opportunities, though others disagree.
Which NBA Stats Matter Most for Prop Betting
My prop betting improved dramatically when I stopped looking at season averages and started focusing on the statistics that actually predict single-game performance. A player averaging 22 points tells you something, but understanding why he averages 22 points tells you far more about when he will hit 28 and when he will struggle to reach 18.
Usage rate measures what percentage of team possessions a player uses while on the floor. High usage players take more shots, handle the ball more, and generally drive their team’s offence. When teammates are injured, usage typically rises. When facing elite defenders, usage might drop. This statistic helps explain scoring variance better than simple points per game because it captures opportunity rather than outcome. A player with 28% usage will have more chances to produce than one with 18% usage, assuming equal minutes.
Minutes played consistency matters more than average minutes. Some players see rock-steady 34-36 minutes every game. Others swing from 28 to 42 depending on matchup, foul trouble, and game flow. Volatile minute players create volatile prop outcomes. Before betting any prop, check how stable a player’s playing time has been recently – not just the average, but the range. A player averaging 32 minutes with a range of 30-35 is far more predictable than one averaging 32 minutes with a range of 24-40.
The NBA’s 82-game schedule creates measurable fatigue patterns that directly impact betting outcomes. Research shows performance drops of 1-3 points on the second night of back-to-back games. Each team faces roughly 15 back-to-back situations per season, and these games consistently show lower offensive output from fatigued players. Prop lines sometimes adjust for back-to-backs, but not always fully. This creates systematic opportunity.
Pace affects every counting statistic. Fast-paced games mean more possessions, more shots, more rebounds, more of everything. Two teams averaging 105 possessions per game will produce more total statistics than two teams averaging 95 possessions. When researching props, compare the expected pace of the specific matchup to the player’s typical pace environment. A player moving from a slow-paced opponent to a fast-paced one should see inflated raw numbers even with identical per-possession performance.
Defensive matchup data has become increasingly accessible. Websites track how many points per game opposing players score against specific defenders and specific teams. If a scorer faces a team allowing 25 points per game to his position versus his season average of 22, that contextual boost matters. The inverse applies equally – elite defensive opponents suppress scoring in predictable ways.
Researching Player Props: A Step-by-Step Process
Before any significant prop bet, I run through the same checklist. Not because I enjoy process for its own sake, but because skipping steps has cost me money. The research takes perhaps 10 minutes per player once you establish a routine. That investment of time separates informed wagers from casual guesses.
Start with recent performance, not season averages. I look at the last 10 games first, then the last 5, then the last 3. This progression shows trajectory. Is the player trending up, down, or steady? A scorer averaging 24 points who posted 18, 20, 21, 19, 22 over his last five games is not the same as one who posted 28, 30, 26, 27, 29. The season number might be identical, but the recent context differs entirely. Minutes follow the same logic – recent playing time matters more than season average if there has been a shift.
Check the injury report next. Not just for your target player, but for everyone on his team. When a primary scorer sits, secondary players see increased opportunities. When a point guard is out, someone else handles the ball more. These ripple effects create prop value that season averages cannot capture. The player’s own injury status matters too – someone playing through a minor ailment might see reduced minutes or efficiency even if active.
Analyse the opponent’s defensive profile. How many points do they allow to the position your player occupies? How many rebounds do they surrender? How many assists do opposing point guards accumulate against them? These defensive statistics exist for teams and increasingly for individual defenders. A centre facing a team that allows the most rebounds to opposing centres has a structural advantage over one facing a dominant rebounding team.
Consider rest and travel. Is this a back-to-back? How far did the team travel? What time zone did they arrive from? Players on the second night of back-to-back games, especially with travel, consistently underperform their baselines. The market accounts for some of this, but not always efficiently. I give extra weight to fatigue factors when they stack – a team playing its fourth game in six nights, crossing multiple time zones, facing a rested opponent.
Compare your projection to the bookmaker’s line. After all research, I write down what I expect the player to produce before looking at the posted prop. If I expect 26 points and the line is 24.5, that gap suggests potential over value. If I expect 22 and the line is 24.5, I either pass or consider the under. This discipline prevents anchoring to the posted number and forces independent analysis.
Finally, check for line movement. If a points prop has moved from 24.5 to 26.5 since opening, that tells you sharp money or significant information has pushed the number higher. You might still bet the over at 26.5, but you should understand that the market has already adjusted in that direction. Conversely, a line that has moved toward you might signal value the broader market has missed.
Matchup Analysis for Points and Rebounds Props
The first time I watched Nikola Jokic play in Denver, the altitude hit me before I even processed the basketball. Mile-high elevation affects everything – conditioning, shooting touch, even ball flight. It also affects betting outcomes in ways that extend far beyond home court advantage. The Denver Nuggets hold a home court true performance rating of +4.6 points – the best in the NBA – and this edge extends to individual player props when opponents visit the thin air.
Defensive ratings by position form the backbone of points prop analysis. Every team defends certain positions better than others. A team might rank 5th in overall defensive efficiency but 25th in defending opposing centres. If you are betting a centre’s points prop against that team, the positional ranking matters more than the overall number. These splits are widely available and update throughout the season as sample sizes grow.
Individual defender assignments create further granularity. When a star scorer faces an elite perimeter defender, his efficiency typically drops. When that same scorer faces a team without a capable primary defender at his position, he feasts. Tracking likely matchups – which requires knowing team defensive schemes and rotation patterns – adds edge that aggregated team statistics miss. Not every team plays man-to-man defence, and scheme differences affect how positional matchup data applies.
Rebounds present a different analytical challenge. Rebounding opportunity depends on missed shots – both your team’s and the opponent’s. A centre on a high-efficiency team that rarely misses will have fewer offensive rebounding chances than one on a poor shooting team. Conversely, that same centre will have more defensive rebounding chances if the opponent misses frequently. Pace and shooting efficiency on both sides combine to determine total rebounding opportunity in ways that pure rebounding rates do not capture.
Opponent rebounding rate matters enormously. Some teams crash the offensive glass aggressively, reducing the defensive rebounds available to your target player. Others prioritise transition defence and abandon offensive rebounds almost entirely. When a strong rebounder faces a team that does not contest the defensive glass, his rebound numbers inflate beyond his normal rate. The inverse applies when facing aggressive offensive rebounding teams – the available rebounds get contested and split.
Home versus away splits deserve attention for both points and rebounds. Some players perform markedly better at home – whether from comfort, crowd energy, or referee treatment. Others are road warriors whose production stays consistent regardless of venue. Checking a player’s home/away splits over a reasonable sample reveals which category he falls into. A player averaging 8 rebounds at home but only 6 on the road should have different prop expectations depending on game location.
Assists Props: Reading Playmaker Opportunities
Assists are the most team-dependent statistic in basketball. A point guard can create the perfect shot for a teammate, execute flawless decision-making, and still finish with zero assists if his teammates miss every look he generates. This dependency makes assists props both frustrating and analytically interesting – the variance creates mispricing opportunities that more predictable statistics lack.
Point guard assist rates set the baseline for any assists prop analysis. Elite playmakers like Trae Young or Tyrese Haliburton post assist percentages above 40% – meaning more than 40% of their teammates’ made field goals come from their passes while they are on the floor. This rate, combined with playing time and team scoring, roughly predicts assist totals. A 40% assist rate player on a team scoring 115 points in a game should accumulate significant assists even if the specific number varies.
Team shooting percentage creates the direct dependency. If teammates shoot 50% from the field, more of those created shots convert to assists. If they shoot 40%, the same quality of passes produces fewer assists. Checking how a team has been shooting recently – particularly the players most likely to receive passes from your target playmaker – adds predictive value beyond simple averages.
Pace correlation affects assists just as it affects other counting stats, but with a twist. Higher pace means more possessions and more shot attempts, which creates more assist opportunities. However, transition play – which increases with pace – often involves fewer assists than half-court offence because fast break scores frequently come without assists. The relationship is positive but not perfectly linear.
Blowout risk presents the most significant downside for assists props. When games become uncompetitive, star players sit. A point guard averaging 10 assists per game might play only 28 minutes in a blowout instead of his usual 36. Those lost minutes directly translate to lost assists. Before betting an assists over, consider whether the game projects as competitive. Close games mean more minutes for starters, which means more assists opportunities.
Opponent assist defence varies substantially. Some teams defend the pick-and-roll aggressively and force turnovers rather than allowing clean looks. Others switch frequently and give up assists at high rates. How many assists per game does the opponent typically allow to opposing point guards? This defensive tendency, combined with your target’s typical production, frames reasonable expectations for the matchup.
Prop Betting and League Integrity
The explosion of player prop betting has created uncomfortable questions that the NBA and its bettors cannot ignore. Individual statistics are easier to manipulate than game outcomes. A player could theoretically affect his own rebounding total without meaningfully changing whether his team wins or loses. This vulnerability has drawn attention from the league’s highest levels.
NBA Commissioner Adam Silver addressed prop betting concerns directly when discussing league efforts to maintain integrity. The league has asked some betting partners to pull back on certain prop bets, especially those involving two-way players – developmental athletes who split time between the NBA and its minor league. These players have less financial stake in outcomes and potentially more vulnerability to manipulation. Silver’s message was clear: some prop markets create risks that others do not.
The betting-driven fan engagement cuts both ways. Research shows that 30% of millennial and 24% of Gen Z bettors became fans of new teams specifically through gambling. This engagement drives viewership, merchandise sales, and overall league growth. But it also creates incentive structures that traditional sports fandom lacked. When fans have money on a player’s assists total, their relationship with that player changes.
Responsible betting context matters here. UK bettors operate within a regulated market with strong consumer protections. The Gambling Commission oversees licensed operators, and problem gambling resources are widely available. Prop betting itself is not inherently problematic – it is simply a market structure like any other. But the specific vulnerabilities of individual performance markets deserve acknowledgment.
From a practical betting perspective, integrity concerns translate to market risks. If a prop line seems too good to be true – far off where you would expect based on normal analysis – pause and consider why. Bookmakers have access to information and monitoring systems that individual bettors lack. A strange line might reflect injury information not yet public, or it might reflect bookmaker concern about the market itself. Either way, unexplained mispricing deserves skepticism rather than excitement.
I avoid certain prop markets entirely based on these concerns. Props on players with minimal NBA stakes – end-of-bench players, two-way contracts, or players in contract years with teams out of playoff contention – carry risks that established stars do not. This is not an accusation against any individual player, but rather an acknowledgment that incentive structures matter. Focusing prop betting on high-profile players in competitive situations reduces exposure to the edges of the market where vulnerabilities concentrate.
Building a Props Betting Portfolio
Single prop bets carry inherent variance that diversification can smooth. Treating prop betting like an investment portfolio – spreading risk across multiple positions rather than concentrating on single wagers – has improved both my returns and my psychological relationship with the outcomes.
Diversification across players reduces dependency on individual performance variance. If you bet five player props per night instead of one large prop bet, a single bad performance does not sink your session. The player who goes cold from three, the one who picks up early foul trouble, the one whose team blows out the opponent and sits the fourth quarter – these individual disappointments matter less when spread across a broader portfolio.
Correlation awareness prevents false diversification. Betting the over on two players from the same team means both bets benefit from a high-scoring game and both suffer in a low-scoring one. That is not true diversification – the positions are correlated. Similarly, betting multiple props on the same player across different categories (points, rebounds, assists) creates correlation because all depend on his playing time. True diversification means spreading bets across different games, different teams, and different statistical categories.
Record keeping separates professionals from hobbyists. Track every prop bet – not just wins and losses, but the specific reasoning behind each wager. What did your research suggest? What was the line? What was the actual result? Over hundreds of bets, patterns emerge. Maybe you consistently overestimate certain players. Maybe you underperform on rebounds props but crush assists props. This data reveals where your analytical edge actually exists and where it does not.
Sample size determines meaningful conclusions. One good night means nothing. One good week means almost nothing. Even one good month carries substantial luck influence. I evaluate my prop betting performance over minimum 200-bet samples before drawing any conclusions about edge. Smaller samples tell you about variance, not skill. Be patient with assessment – both positive and negative short-term results can mislead.
Bankroll allocation for props should reflect their higher variance compared to spread betting. I stake props smaller than game spreads precisely because single-player outcomes swing more than team outcomes. A reasonable approach might allocate 1-2% of betting bankroll per prop versus 2-3% per spread bet. The exact percentages depend on your overall risk tolerance, but the principle of smaller prop stakes holds regardless.
What NBA stats matter most for prop betting?
Usage rate, minutes consistency, and pace rank among the most predictive statistics. Usage shows how much of the offence flows through a player, minutes consistency indicates playing time reliability, and pace affects all counting statistics by determining total possessions. Defensive matchup data and recent performance trends add further predictive value.
How do injuries affect player prop lines?
Injuries to teammates often increase prop lines for remaining players due to increased usage and opportunity. Injuries to the target player himself may result in lower lines or complete removal from the market. Smart prop bettors monitor injury reports for both types of effects and act quickly when status changes.
Are NBA player props available at UK bookmakers?
Yes, most UK-licensed bookmakers offer NBA player props, though selection varies. Major bookmakers typically list points, rebounds, assists, and combo props for star players. Smaller market props like steals, blocks, or specialty bets may have limited availability compared to American sportsbooks.
What is a PRA prop in NBA betting?
PRA stands for points plus rebounds plus assists combined into a single total. A PRA prop line might be set at 38.5, requiring the player to accumulate 39 or more combined counting stats across all three categories to hit the over. PRA props reduce variance compared to single-stat props because production can come from multiple sources.
Written by the editors at nba Betting Chart.